Agricultural & Processed Food Products Export Development Authority (APEDA) exported fruits and vegetables - both fresh and processed, worth USD 2.61 billion and imported worth USD 4.62 billion during 2016-17. Share of fresh f&v in export and import was 59% and 19% respectively while respective share of processed f&v was 41% and 81%. Overall f&v contributed 16.1% and 62.7% of APEDA’s total export and import values. Fresh f&v export, in quantity and INR value terms, respectively grew at a CAGR of 28.5% and at 17.6% between 2014-15 and 2016-17. For the same period processed f&v import grew at a CAGR of 21.4% in quantity terms and at 29.3% in value terms.
|
International trade of fruits & vegetables |
||||||
|
F&V Trade (USD Billion) |
2014-15 |
2015-16 |
2016-17 | |||
|---|---|---|---|---|---|---|
|
Export |
Import |
Export |
Import | Export |
Import |
Export |
|
Fresh F&V |
1.22 |
0.89 |
1.39 |
0.83 |
1.54 |
0.88 |
|
Processed F&V |
1.1 |
2.45 |
1.09 |
3.49 |
1.07 |
3.74 |
|
Total Food |
21.5 |
4.67 |
16.4 |
5.8 |
16.17 |
7.37 |
|
All-India Total |
310.34 |
448.03 |
262.29 |
381 |
NA |
NA |
|
Share (%) of Food in Total |
6.93 |
1.04 |
6.25 |
1.52 |
||
Source: APEDA; 1USD = INR 67.00
Production
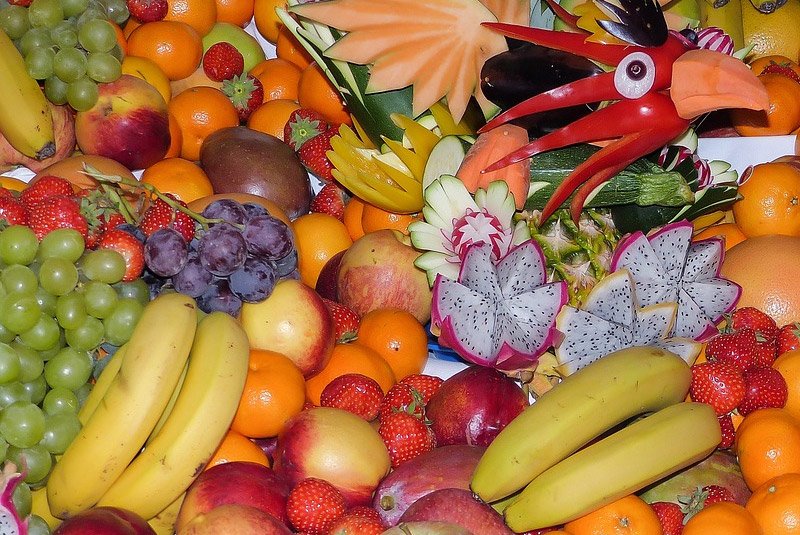
India ranks second in fruits and vegetables production in the world. India is also the largest producer of ginger and okra amongst vegetables and ranks second in production of potatoes, onions, cauliflowers, brinjal, cabbages, etc. Among fruits, the country ranks first in production of bananas (26.04%), papayas (44.51%) and mangoes (including mangosteens and guavas) (40.75%). As per National Horticulture Database published by National Horticulture Board, during 2014-15 India produced 86.602 million metric tons of fruits and 169.478 million metric tons of vegetables. The area under cultivation of fruits stood at 6.110 million hectares and vegetables at 9.542 million hectares.
Deregulation of f&v marketing
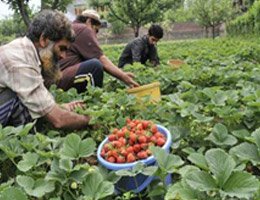
Fruits & vegetables being perishable crops need different set of markets and marketing system with reduced supply chain and adequate marketing infrastructure including cold storage & cold chain. Existing organized system of marketing through network of APMC markets used to be attributed for high post-harvest losses, long intermediation in supply chain and low return to the farmers. In order to address this issue, Government has been advocating with the states to develop marketing infrastructure outside the market yards with involvement of all stakeholders so as to facilitate emergence of various other channels of marketing besides APMC. Till the time of writing this article, 14 States viz. Madhya Pradesh, Himachal Pradesh, Delhi, West Bengal, Odisha, Rajasthan, Chhattisgarh, Gujarat, Maharashtra, Haryana, Karnataka, Assam, Nagaland and Meghalaya had already moved in this direction, though in varied forms.
Domestic consumption
While Private Final Consumption Expenditure (PFCE) in India grew at a CAGR of 12.8% between 2012 and 2016 food segment, growing at CAGR of 11.6%, remained largest component in India’s consumption basket with 32.4% share in total PFCE. Consumption of food-grocery (raw & processed form) and foodservice (cooked & served F&B) grew at a CAGR of 12.1% and 7.2%, respectively. Within F-G, fresh produce including fruits and vegetables grew at a CAGR of 13.1% and 12.5%, respectively.
|
Food Item Groups (At current prices) (In Rs Cr) |
2011-12 |
2012-13 |
2013-2014 | 2014-2015 | 2015-2016 |
|---|---|---|---|---|---|
|
Bread, cereals and pulses |
4,25,173 |
5,10,194 |
5,12,353 |
5,27,571 |
3,62,530 |
|
Meat |
42,976 |
50,920 |
62,578 |
69,213 |
74,448 |
|
Fish and seafood |
76,041 |
89,467 |
1,09,359 |
1,29,322 |
1,41,319 |
|
Milk, cheese and eggs |
3,34,315 |
3,89,301 |
4,32,944 |
5,04,491 |
5,62,803 |
|
Oils and fats |
98,458 |
1,20,962 |
1,27,029 |
1,08,328 |
1,06,082 |
|
Fruit |
2,15,835 |
2,50,953 |
3,09,098 |
3,47,293 |
3,53,651 |
|
Vegetables |
1,81,035 |
2,09,081 |
2,59,246 |
2,95,562 |
2,89,887 |
|
Sugar, jam, honey, chocolate and confectionery |
72,797 |
81,111 |
90,670 |
91,998 |
86,938 |
|
Food products n.e.c. (misc) |
86,795 |
1,05,108 |
1,27,121 |
1,54,077 |
1,85,520 |
|
Non-alcoholic beverages |
28,957 |
28,872 |
32,129 |
37,948 |
37,676 |
|
Total Food grocery (A) |
14,99,739 |
17,50,948 |
20,60,368 |
22,50,585 |
23,65,895 |
|
Alcoholic beverages |
46,811 |
39,497 |
42,757 |
52,977 |
50,353 |
|
Restaurants and hotels |
1,16,491 |
1,29,318 |
1,38,559 |
1,49,067 |
1,65,031 |
|
Total Food Service (B) |
1,63,302 |
1,68,815 |
1,81,316 |
2,02,044 |
2,15,384 |
|
Total Food consumption (A)+(B) |
16,63,041 |
19,19,763 |
22,41,684 |
24,52,629 |
25,81,279 |
|
Private Final Consumption Expenditure (PFCE) |
49,35,996 |
56,51,159 |
65,15,986 |
72,67,128 |
79,78,905 |
Source: MOSPI
F&v retail market

According to India Food Report 2018 fresh f&v is the third largest segment in total food-grocery retail market. Vegetables contribute 70% of f&v retail market estimated at Rs. 5,40,174 Cr and 30% is contributed by fruits. Though f&v is price sensitive market but occasionally shows volatility too. Seasonality, logistic, supply chain, middle men lobby etc are key influencers for price fluctuation. The market struggles due to lack of quality standards and high wastage share. Modern retailers offer f&v in raw natural as well as in cut and packaged form for customer convenience. However, a large part of fresh f&v market is unorganised and operates through push cart retailers, street hawkers, weekly markets and F&V stalls / shops. As of 2014 sixty per cent of total f&v retail market was rural which saw a drop of 3% in 2017 thus increasing urban market share to 43%. Growing steady at a CAGR of 13.6%, the fresh produce retail market, today, is estimated at around Rs. 8 Lakh Cr.
Consumption trend*
Fresh Produce (Per Capita Annual Consumption)
|
2012 (In Rs) |
2016 (In Rs) |
CAGR (2012-2016) |
|
|---|---|---|---|
|
Fruit |
1,753 |
2,680 |
11.2% |
|
Vegetables |
1,471 |
2,197 |
10.6% |
|
Total Food |
13,510 |
19,563 |
9.7% |
Source: JORSS analysis of government data
Indian consumers consume less than the WHO-recommended quantity of at least 400 grams of f&v. The average intake among urban Indians is 3.5 servings per day, which comprise 1.5 servings of fruits and 2 servings of vegetables. The average intake of the younger generation is even lower. For age group of 18-25 years it is 2.97 servings per day and for 18-35 years it is 3.3 servings per day. The average intake among the students is abysmally low at 2.94 servings per day. Housewives do better in terms of F&V intake with an average intake of 3.65 servings as compared to working persons which is 3.5 servings per day. Besides food habits income also plays important role in f&v consumption as average daily intake is found higher for higher income groups. There are also variations across diet types. The average daily intake of f&v is 3.97 servings for a person with a Jain diet, while it is 3.87 servings for a vegetarian, 3.43 servings for an eggetarian and 3.2 servings for a non-vegetarian.
*ICRIER’s India’s Phytonutrient Report, 2016
Key developments
There is a surge in demand for f&v due to shift towards healthy food consumption. As a consequence, Indian farmers are also shifting their focus towards producing horticulture crops to cash in on the growing demand. Simultaneously there is an increased market for imported f&v ranging from exotic picks to global varieties. To further aid the need for healthy intake organic fresh produce has also created its own consumer markets. The trend has also caught up with food companies like ITC which entered into veggie mart with Farmland in November 2017. The company planned to sell its fresh produce at 10-15% premium price over local market rates.